Resistivity tells you where hydrocarbons are in the well you drilled. Pressure tells you something the logs cannot: what fluid is continuous through the pore system, and at what depth the hydrocarbon column ends, even below the bottom of the well. That makes formation pressure data the natural check on a log interpretation, and the free water level it gives is often the single most important number in a volumetric estimate.
The method is simple. The care is in the details, and the worked example below shows how much a contact moves with errors that look small.
Gradients are densities
In a continuous fluid column at rest, pressure increases with true vertical depth at a rate set by the fluid's density:
dP/dZ (psi/ft) = 0.433 × ρ (g/cc)
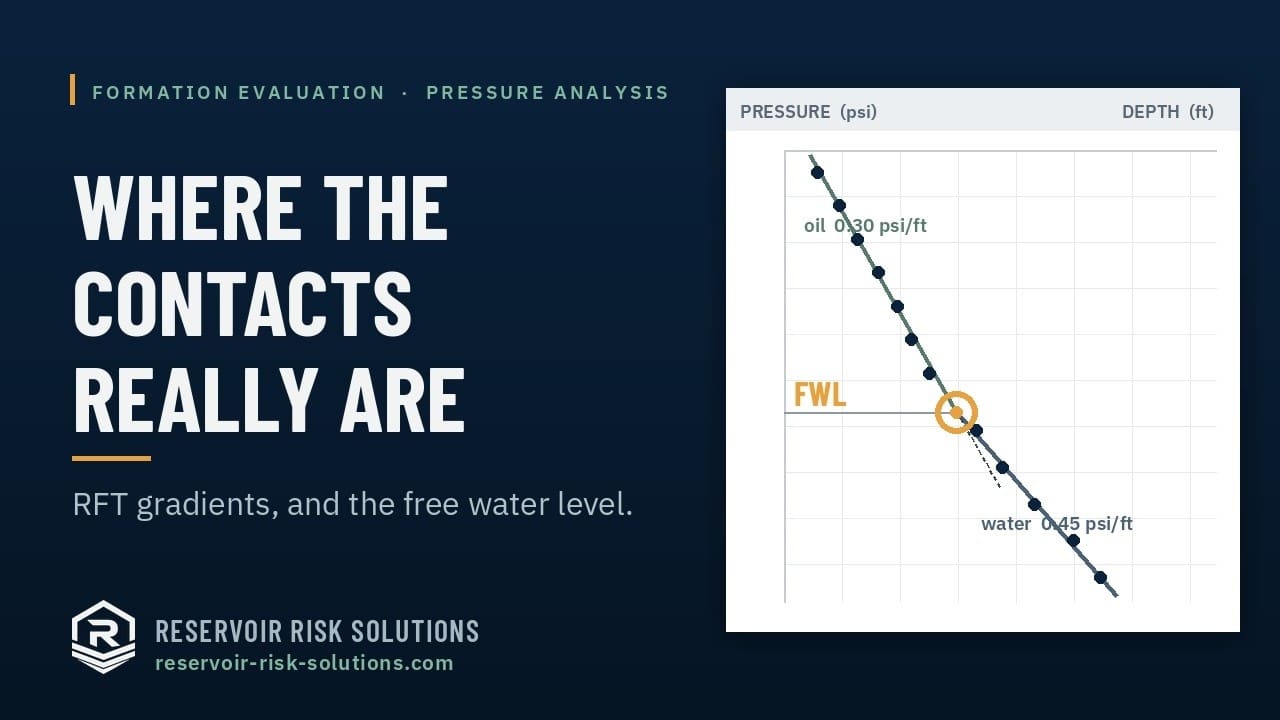
So a gradient identifies the fluid. Typical ranges are about 0.43 to 0.52 psi/ft for formation water depending on salinity, 0.25 to 0.40 for oil, and 0.05 to 0.15 for gas, though a light oil and a rich gas condensate can approach each other. Points that fall on one straight line on a pressure–depth plot are in the same continuous fluid; a change of slope marks a change of fluid; and where two fitted lines cross, the pressures of the two phases are equal.
A worked example
Six pressure tests in a vertical well, three in the oil leg and three in the water leg below it:
Depth (ft TVD)   Pressure (psi)
8,000            3,630.0
8,050            3,645.0
8,100            3,660.0
8,250            3,712.5
8,300            3,735.0
8,350            3,757.5
Fit each leg. The oil points rise 30 psi over 100 ft, a gradient of 0.30 psi/ft; the water points rise 45 psi over 100 ft, 0.45 psi/ft. With equally spaced, noise-free points a least-squares fit gives the same slopes, through the mean point of each leg:
oil:    P = 3,645 + 0.30 × (D − 8,050) = 1,230 + 0.30 × D
water:  P = 3,735 + 0.45 × (D − 8,300) = 0.45 × D
The water line passes through zero at surface, so this aquifer is normally pressured for its brine.
Implied densities. 0.30 / 0.433 = 0.69 g/cc for the oil, 0.45 / 0.433 = 1.04 g/cc for the water. Both are plausible, which is a first check on the data.
Where the lines cross.
0.45 × D = 1,230 + 0.30 × D
0.15 × D = 1,230
D        = 8,200 ft TVD,   P = 0.45 × 8,200 = 3,690 psi
That depth, 8,200 ft, is the free water level: the depth at which oil and water pressures are equal and capillary pressure is zero.
The free water level is not the oil–water contact
The contact you see on the logs is the top of the interval that is fully water-saturated, and in a water-wet rock it sits above the free water level. Oil can enter the pores only where the capillary pressure, which grows with height above the free water level, exceeds the rock's entry pressure:
height of OWC above FWL = Pd / (gradient_water − gradient_oil)
For a good sand with an entry pressure of 1.5 psi at reservoir conditions, 1.5 / 0.15 = 10 ft, so the log contact would be near 8,190 ft. For a tight rock with an entry pressure of 15 psi it is 100 ft. Above the contact, saturation changes through a transition zone whose thickness also depends on rock quality.
This is why a log-picked contact in a poor-quality well and a pressure-derived free water level can disagree by tens of feet with both being right. Using the log contact as if it were the free water level misplaces the base of the column; using the free water level to compute saturation without a saturation-height model overstates the hydrocarbon in the transition zone.
How far the answer moves
The contact is the intersection of two lines that cross at a shallow angle, 0.15 psi/ft apart, so small errors are magnified.
A pressure offset. If the oil tests read 0.5 psi high, from gauge error or slight supercharging, the oil line moves up by 0.5 psi and the intersection moves by 0.5 / 0.15 = 3.3 ft. A 3 psi offset, not unusual in low-mobility rock where mud filtrate has not dissipated, moves it 20 ft.
A gradient error. Suppose the oil gradient is fitted as 0.31 instead of 0.30 psi/ft, still through the mean oil point:
0.45 × D = 3,645 + 0.31 × (D − 8,050)
0.14 × D = 1,149.5
D        = 8,210.7 ft
A 0.01 psi/ft error moves the free water level about 11 ft, because the line is being extrapolated 150 ft from the centre of the oil data. Three tests over 100 ft constrain a gradient less well than the neatness of this example suggests, and the uncertainty grows with the extrapolation distance. A fit that reports its own standard errors, and a contact depth with a confidence interval rather than a single value, is worth having.
Measured depth in a deviated well. Gradients are densities only per unit of vertical depth. In a well inclined at 40 degrees, a 0.45 psi/ft water leg plotted against measured depth shows a slope of 0.45 × cos 40° = 0.345 psi/ft, which reads as oil. Every point has to go to true vertical depth, from the well survey, before fitting.
Reading the plot more sharply
On a full pressure–depth plot the lines for oil and water look almost parallel. Subtracting a reference water gradient makes the differences visible. Plot the excess pressure, P − 0.45 × D, against depth:
8,000 ft   3,630.0 − 3,600.0 = 30.0 psi
8,050 ft   3,645.0 − 3,622.5 = 22.5 psi
8,100 ft   3,660.0 − 3,645.0 = 15.0 psi
8,250 ft and below           =  0.0 psi
The water points collapse onto a vertical line at zero, the oil points form a line that leans away from it, and the free water level is where that line reaches zero. Points that sit off either line, a supercharged test or a separate compartment, stand out at once.
When the pressures disagree with the logs
- Different water lines. Water points in two sands that fall on parallel lines offset from each other are not in pressure communication. They may share a fluid but not a free water level, and each compartment needs its own.
- Supercharged tests. Points that read high in tight intervals, often with poor drawdown or slow build-up, should be screened on test quality and mobility before they are fitted.
- Too few points. Two points always define a line. Without a third, there is no check on either point and no statistical measure of the gradient.
- A column below the well. If the well reached only the oil leg, the free water level has to come from an assumed water gradient, ideally anchored to a regional aquifer pressure. That is an assumption, and it belongs in the low, mid and high contact cases.
For a thorough treatment of these error sources, see Brown (2003).
The Pressure and Contact Consistency module of the Intermediate Petrophysics track covers this ground, including building contact ranges for volumetrics; the Log Reading and Contact Picking module of the Basic track covers the log side of the same question.
In the platform
Formation Evaluation imports formation pressure points, converts them to true vertical depth from the well survey, fits a gradient to each fluid leg by least squares with its implied density, and reports each contact at the intersection of two fitted lines with a 95 percent confidence interval on its depth. The contacts can then be shown against the logs.
References
- Brown, A. (2003). Improved interpretation of wireline pressure data. AAPG Bulletin, 87(2).